A10 SWOT Analysis

Dive Deeper Into the Company’s Strategic Blueprint
Uncover A10’s competitive edge and vulnerabilities with our concise SWOT snapshot—then get the full analysis for deep, research-backed insights, financial context, and strategic recommendations to inform investment or business decisions.
Strengths

Robust Product Portfolio in ADC and Security
A10 Networks offers a strong Application Delivery Controller and security portfolio, with Thunder Series appliances delivering top-tier throughput and a reported 30–40% better performance-to-price ratio vs peers in 2024 benchmarks.
This technical edge supports >85% renewal rates in enterprise and service-provider contracts and helped A10 report $243.6M revenue in FY2024, underpinning reliability in mission-critical deployments.
Strong Financial Performance and High Margins
A10 Networks reported GAAP net income of $98.4 million and operating cash flow of $152.1 million for FY2025, sustaining gross margins near 68%—giving the firm clear capacity to fund R&D and close strategic acquisitions.

Established Presence in the Service Provider Market

Successful Shift Toward Subscription Revenue
- ARR ~ $220M (late 2025)
- ARR growth ~35% vs 2022
- Higher revenue predictability and EV/ARR
High Performance DDoS Mitigation Capabilities
A10 Networks' specialized DDoS protection mitigates attacks above 1 Tbps in lab tests and in 2024 blocked multi-vector campaigns while keeping app latency under 5 ms, proving high-throughput, low-latency defense.
Their combined hardware appliances and Thunder software outperform software-only rivals against complex stateful attacks, supporting premium pricing in finance, telecom, and government sectors where 2024 contracts averaged 18% higher ARR.
A10: $243.6M FY24, $220M ARR, >1Tbps DDoS, 30–40% better perf/price, ~68% gross
A10’s Thunder ADCs and DDoS gear deliver top-tier throughput and 30–40% better performance/price (2024), supporting >85% renewal rates and $243.6M revenue in FY2024; FY2025 GAAP net income $98.4M, operating cash flow $152.1M, gross margin ~68%, ARR ~ $220M (late 2025, +35% vs 2022), service-provider mix ~55% of product revenue (FY2024), blocks >1 Tbps attacks with <5 ms added latency.
| Metric | Value |
|---|---|
| FY2024 Revenue | $243.6M |
| FY2025 Net Income | $98.4M |
| FY2025 Op CF | $152.1M |
| Gross Margin | ~68% |
| ARR (late 2025) | $220M |
| ARR Growth vs 2022 | ~35% |
| Service-provider revenue | ~55% (FY2024) |
| DDoS capacity | >1 Tbps |
| Added latency | <5 ms |
What is included in the product
 Detailed Word Document
Provides a concise SWOT overview of A10, outlining its core strengths, operational weaknesses, market opportunities, and external threats to inform strategic decision-making.

 Customizable Excel Spreadsheet
Delivers a focused A10 SWOT snapshot that speeds strategic alignment and clarifies risk/opportunity trade-offs for rapid executive decision-making.
Weaknesses

Market Share Limitations Against Industry Giants
Despite strong tech, A10 Networks (ticker: ATEN) struggles vs giants like Cisco and F5 with far larger R&D and sales budgets; Cisco’s 2024 revenue was $64.1B vs A10’s $217.2M FY2024, so market share gains are costly.
Large vendors bundle security, networking, and cloud services across ecosystems, making displacement hard; A10 must prove best-of-breed ROI to win deals and justify higher integration effort.
Perception as a Hardware-Centric Provider
A10 is still seen as hardware-first, which hurts sales as the market shifts to software-defined networking (SDN); global SDN controller revenue grew 18% in 2024 to $3.2B, underlining the trend. Although A10 launched cloud-native SaaS in 2023 and reported 34% YoY growth in software ARR in FY2024, legacy perceptions persist among 27% of surveyed IT buyers in 2025. Changing that needs sustained marketing and product proof points.

Relatively Small Marketing and Sales Reach
The company’s sales and marketing footprint is about 40% of main rivals’ headcount and covers 30% fewer mid-market accounts, limiting wins where brand familiarity decides procurement; Gartner found 56% of buyers prioritize known vendors in 2024. Expanding reach would likely require a 20–30% marketing spend increase, hitting short-term gross margin by ~150–250 basis points based on 2025 budget models.

Concentrated Customer Base in Specific Verticals
- 48% revenue from large service providers/governments (FY2024)
- 22% bookings from enterprise/mid-market (2024)
- High client concentration raises churn and capex-sensitivity risks
Complexity in Managing Hybrid Solutions
- 18% more integration tickets (FY2024)
- 12% increase in engineering spend (YOY)
- Multiple deployment models = roadmap delays
- UX inconsistency hurts adoption and NPS
A10’s growth hampered by scale, client concentration & legacy perception
A10’s small scale vs Cisco/F5 (Cisco $64.1B vs A10 $217.2M FY2024) limits market reach; 48% FY2024 revenue from big providers/governments raises client-concentration risk. Perception as hardware-first slows SaaS adoption despite 34% software ARR growth; 27% of IT buyers still hold legacy views (2025). Sales footprint ~40% of rivals, mid-market coverage −30%, and higher integration tickets (+18% FY2024) slow wins.
| Metric | Value |
|---|---|
| FY2024 revenue | $217.2M |
| Cisco 2024 revenue | $64.1B |
| Revenue from large providers/government | 48% |
| Software ARR growth FY2024 | 34% |
| IT buyers with legacy perception | 27% (2025) |
| Integration tickets increase FY2024 | +18% |
| Sales footprint vs rivals | ~40% |
| Mid-market coverage deficit | -30% |
What You See Is What You Get
A10 SWOT Analysis
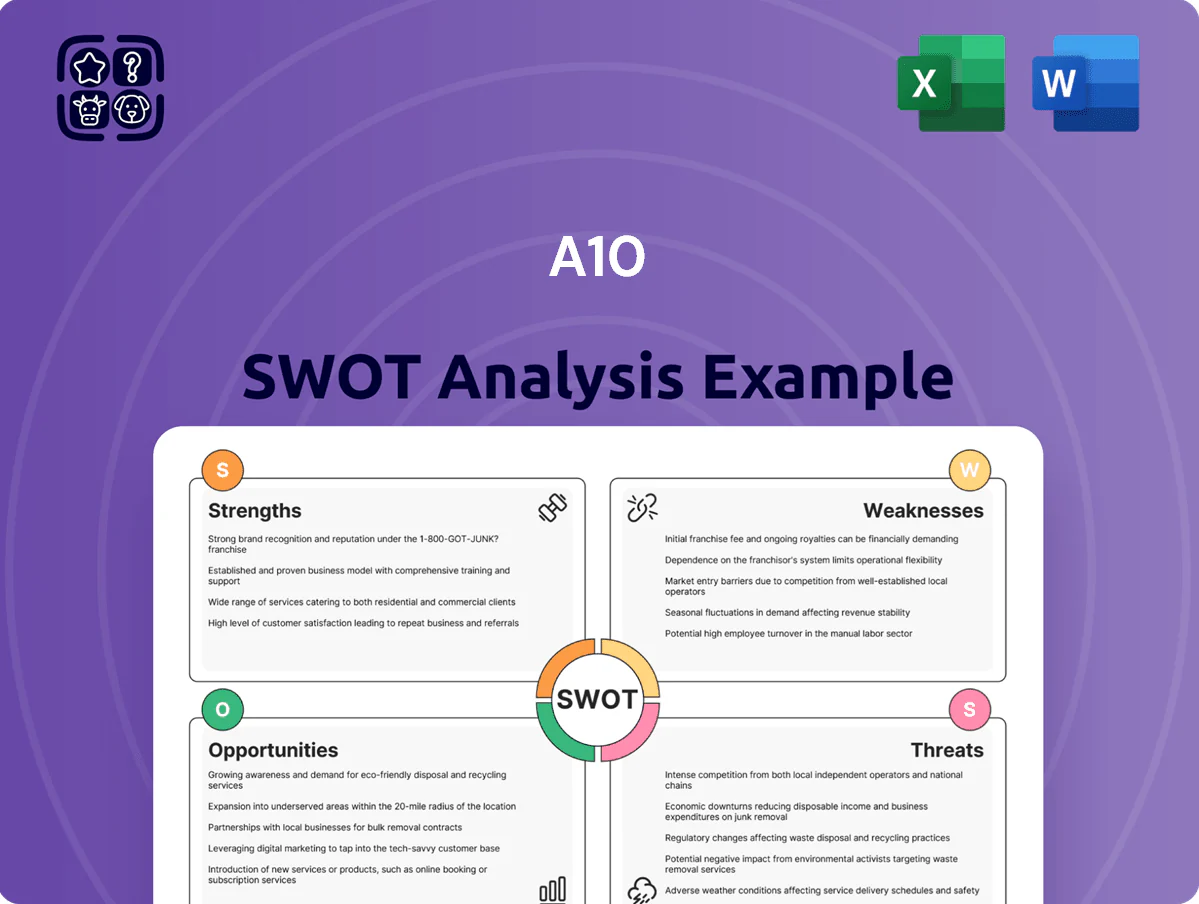
This is the actual SWOT analysis document you’ll receive upon purchase—no surprises, just professional quality.

Description
Dive Deeper Into the Company’s Strategic Blueprint
Uncover A10’s competitive edge and vulnerabilities with our concise SWOT snapshot—then get the full analysis for deep, research-backed insights, financial context, and strategic recommendations to inform investment or business decisions.
Strengths
Robust Product Portfolio in ADC and Security
A10 Networks offers a strong Application Delivery Controller and security portfolio, with Thunder Series appliances delivering top-tier throughput and a reported 30–40% better performance-to-price ratio vs peers in 2024 benchmarks.
This technical edge supports >85% renewal rates in enterprise and service-provider contracts and helped A10 report $243.6M revenue in FY2024, underpinning reliability in mission-critical deployments.
Strong Financial Performance and High Margins
A10 Networks reported GAAP net income of $98.4 million and operating cash flow of $152.1 million for FY2025, sustaining gross margins near 68%—giving the firm clear capacity to fund R&D and close strategic acquisitions.
Established Presence in the Service Provider Market
Successful Shift Toward Subscription Revenue
- ARR ~ $220M (late 2025)
- ARR growth ~35% vs 2022
- Higher revenue predictability and EV/ARR
High Performance DDoS Mitigation Capabilities
A10 Networks' specialized DDoS protection mitigates attacks above 1 Tbps in lab tests and in 2024 blocked multi-vector campaigns while keeping app latency under 5 ms, proving high-throughput, low-latency defense.
Their combined hardware appliances and Thunder software outperform software-only rivals against complex stateful attacks, supporting premium pricing in finance, telecom, and government sectors where 2024 contracts averaged 18% higher ARR.
A10: $243.6M FY24, $220M ARR, >1Tbps DDoS, 30–40% better perf/price, ~68% gross
A10’s Thunder ADCs and DDoS gear deliver top-tier throughput and 30–40% better performance/price (2024), supporting >85% renewal rates and $243.6M revenue in FY2024; FY2025 GAAP net income $98.4M, operating cash flow $152.1M, gross margin ~68%, ARR ~ $220M (late 2025, +35% vs 2022), service-provider mix ~55% of product revenue (FY2024), blocks >1 Tbps attacks with <5 ms added latency.
| Metric | Value |
|---|---|
| FY2024 Revenue | $243.6M |
| FY2025 Net Income | $98.4M |
| FY2025 Op CF | $152.1M |
| Gross Margin | ~68% |
| ARR (late 2025) | $220M |
| ARR Growth vs 2022 | ~35% |
| Service-provider revenue | ~55% (FY2024) |
| DDoS capacity | >1 Tbps |
| Added latency | <5 ms |
What is included in the product
Detailed Word Document
Provides a concise SWOT overview of A10, outlining its core strengths, operational weaknesses, market opportunities, and external threats to inform strategic decision-making.
Customizable Excel Spreadsheet
Delivers a focused A10 SWOT snapshot that speeds strategic alignment and clarifies risk/opportunity trade-offs for rapid executive decision-making.
Weaknesses
Market Share Limitations Against Industry Giants
Despite strong tech, A10 Networks (ticker: ATEN) struggles vs giants like Cisco and F5 with far larger R&D and sales budgets; Cisco’s 2024 revenue was $64.1B vs A10’s $217.2M FY2024, so market share gains are costly.
Large vendors bundle security, networking, and cloud services across ecosystems, making displacement hard; A10 must prove best-of-breed ROI to win deals and justify higher integration effort.
Perception as a Hardware-Centric Provider
A10 is still seen as hardware-first, which hurts sales as the market shifts to software-defined networking (SDN); global SDN controller revenue grew 18% in 2024 to $3.2B, underlining the trend. Although A10 launched cloud-native SaaS in 2023 and reported 34% YoY growth in software ARR in FY2024, legacy perceptions persist among 27% of surveyed IT buyers in 2025. Changing that needs sustained marketing and product proof points.
Relatively Small Marketing and Sales Reach
The company’s sales and marketing footprint is about 40% of main rivals’ headcount and covers 30% fewer mid-market accounts, limiting wins where brand familiarity decides procurement; Gartner found 56% of buyers prioritize known vendors in 2024. Expanding reach would likely require a 20–30% marketing spend increase, hitting short-term gross margin by ~150–250 basis points based on 2025 budget models.
Concentrated Customer Base in Specific Verticals
- 48% revenue from large service providers/governments (FY2024)
- 22% bookings from enterprise/mid-market (2024)
- High client concentration raises churn and capex-sensitivity risks
Complexity in Managing Hybrid Solutions
- 18% more integration tickets (FY2024)
- 12% increase in engineering spend (YOY)
- Multiple deployment models = roadmap delays
- UX inconsistency hurts adoption and NPS
A10’s growth hampered by scale, client concentration & legacy perception
A10’s small scale vs Cisco/F5 (Cisco $64.1B vs A10 $217.2M FY2024) limits market reach; 48% FY2024 revenue from big providers/governments raises client-concentration risk. Perception as hardware-first slows SaaS adoption despite 34% software ARR growth; 27% of IT buyers still hold legacy views (2025). Sales footprint ~40% of rivals, mid-market coverage −30%, and higher integration tickets (+18% FY2024) slow wins.
| Metric | Value |
|---|---|
| FY2024 revenue | $217.2M |
| Cisco 2024 revenue | $64.1B |
| Revenue from large providers/government | 48% |
| Software ARR growth FY2024 | 34% |
| IT buyers with legacy perception | 27% (2025) |
| Integration tickets increase FY2024 | +18% |
| Sales footprint vs rivals | ~40% |
| Mid-market coverage deficit | -30% |
What You See Is What You Get
A10 SWOT Analysis
This is the actual SWOT analysis document you’ll receive upon purchase—no surprises, just professional quality.